 How-to
How to Use Heatmaps to Improve User Experience
Last Updated: November 4, 2026
Quick Summary
Website heatmaps improve user experience by showing where visitors click, scroll, and move their cursor, turning anonymous traffic into a visual record of behavior. Use click, scroll, and move maps together to find friction points, then make one tested layout change at a time.
- Click maps show what visitors press, scroll maps show how deep they go, and move maps show where attention lingers.
- Set up tracking in four steps: install the script, pick key pages, set a collection window, and review the data.
- Watch for dead clicks, rage clicks, cold zones, and drop-off lines when analyzing heatmap data.
- Mask sensitive form fields and gate the heatmap script behind consent where required.
- Change one thing at a time and run A/B tests so you know what worked.
Table of Contents
- What Website Heatmaps Reveal About User Behavior
- The Three Heatmap Types: Click, Scroll, and Move Maps
- How to Set Up Heatmap Tracking on Your Site
- How to Analyze Heatmap Data for Friction Points
- Choosing UX Heatmap Tools That Fit Your Budget
- Website Heatmap Best Practices for Reliable Insights
- Turning Heatmap Findings Into Layout Changes That Lift Conversions
- Schedule a Free Consultation to Review Your Heatmap Findings
- Frequently Asked Questions
What Website Heatmaps Reveal About User Behavior
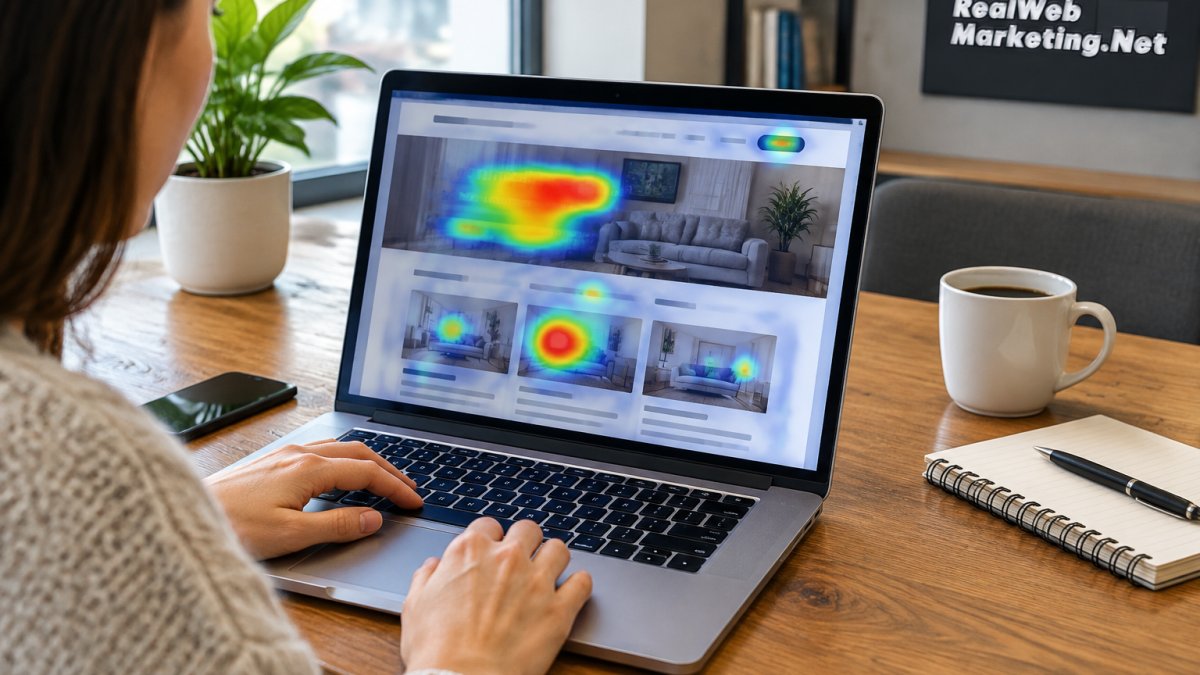
Website heatmaps show where visitors click, scroll, and move their cursor, and heatmaps improve user experience by turning anonymous traffic into a visual record of user behavior.
A heatmap is a color-coded overlay on a page that shows attention and action. Warm colors mark heavy activity; cool colors mark neglect.
Most pages have a silent problem. Visitors land, drift, and leave without ever reaching the call-to-action.
Here is what a heatmap tells you that analytics alone cannot:
- Which buttons get clicked and which get ignored
- How far down the page visitors actually scroll
- Where the cursor hovers before a visitor abandons
- Which sections hold attention and which get skipped
The value is not the colors. It is the friction points they reveal.
The Three Heatmap Types: Click, Scroll, and Move Maps
Each heatmap type answers a different question, so the strongest analysis uses all three together. Click maps show what visitors press. Scroll maps show how deep they go. Move maps show where attention lingers before a decision.
Click maps record taps and clicks on links, buttons, and images. Dead clicks on non-clickable elements are a common find, and they usually mean a design looks interactive when it is not.
Scroll maps show how far visitors reach. If most traffic stops before your main offer, the problem is placement, not the offer.
Move maps track cursor movement and hover time. They hint at user intent: what people reach for, what they pause on, and what they skip.
| Heatmap Type | What It Shows | Best For |
|---|---|---|
| Click map | Where visitors click and tap | Testing call-to-action placement |
| Scroll map | How far down the page they go | Checking content order |
| Move map | Cursor hover and attention | Reading user intent |
How to Set Up Heatmap Tracking on Your Site
Setting up heatmap tracking takes four steps: install the tracking script, pick your key pages, set a collection window, and review the data.
- Install the tracking snippet. Most heatmap tools give you a short script to place in your site header. If you use a tag manager, add it there instead.
- Choose the pages that matter. Start with high-traffic pages and your main conversion pages, not the whole site.
- Set a collection window. Give each page enough traffic to produce a reliable sample before you judge it.
- Segment your traffic. Separate desktop from mobile, and new visitors from returning ones.
Watch out: collecting data on a page with almost no traffic produces noise, not insight. Choose pages that already get steady visits.
If you have web design questions about where the script goes or how your platform handles it, our web design FAQs cover the common cases.
How to Analyze Heatmap Data for Friction Points
Analyzing heatmap data means looking for three signals: clicks that go nowhere, content that gets skipped, and attention that stops short of the call-to-action. Read each signal as a question about user intent, then confirm it against session recordings and bounce rate.

Start with the biggest gap between design intent and actual behavior. Then work down.
- Dead clicks: visitors pressing things that do nothing
- Rage clicks: repeated, frustrated clicking in one spot
- Cold zones: sections almost nobody touches
- Drop-off lines: the scroll depth where attention dies
Pair the heatmap with session recording and usability testing. The map shows where; the recording shows why.
Common Pitfalls That Lead to Bad Design Decisions
A hot spot is not automatically a good sign, and a cold zone is not automatically a problem. Treat every color as a hypothesis, then test it against a second source before you change a page.
- Assuming a click means interest. A dense click cluster on a non-interactive element often signals confusion, not desire. Visitors are trying to open something that looks like a button. Fix the affordance before you add a real link there.
- Reading hover as intent. Move maps show where the cursor rests, but a resting cursor can mean reading, distraction, or a parked pointer. Cross-check hover zones against scroll depth and time on page before you call a section "engaging."
- Treating cold zones as dead weight. A low-activity section may be doing quiet work, trust badges, shipping terms, or a reassurance line that reduces support tickets. Remove it only after you confirm it is not carrying conversion weight.
- Confusing rage clicks with enthusiasm. Repeated clicking in one spot is frustration. If the element is a working button, the problem is usually latency or a missing confirmation state, not the button itself.
- Overreading small samples. A page with a few hundred sessions produces noisy maps.
A useful discipline is to write down the question before you open the map.
For pages bleeding traffic, our guide on how to fix high bounce rates on service pages walks through the diagnosis step by step.
Schedule a Free Consultation →
Choosing UX Heatmap Tools That Fit Your Budget
Choose a UX heatmap tool by matching its limits to your traffic, not by chasing the longest feature list. Most tools price by pageviews, so a small site can often run on a free or low-cost plan while a busy site pays more.
Compare tools on these points:
- Monthly pageview limit and what happens when you exceed it
- Click, scroll, and move maps included in the base plan
- Session recording and funnel tools bundled in
- Privacy controls, including consent handling and data masking
- Ease of install and how well it works on mobile
Many small teams find that one focused tool covers their needs. Buying a large suite before you have the traffic to use it is a common waste.
Website Heatmap Best Practices for Reliable Insights
Reliable website heatmap best practices come down to good sampling, clean segmentation, honest interpretation, and lawful data handling. A heatmap is only as trustworthy as the data behind it, and only as safe as the consent and masking rules you apply to it.
- Let each page collect enough sessions before you draw conclusions
- Split mobile and desktop reports; they rarely match
- Tag campaigns so paid and organic traffic stay separate
- Mask sensitive fields so you never capture personal data
- Re-run reports after every design change to confirm the effect
Privacy and Consent: The Step Most Guides Skip
Heatmap tools can record mouse movement, clicks, and scroll depth, and some also capture keystrokes. That makes them a data-collection system, not just a design toy, and it puts them inside the scope of state privacy laws and platform consent requirements.
Practical steps that hold up under review:
- Disclose heatmap tracking in your privacy policy. Name the category of data collected (interaction and device data) and the purpose (usability analysis). Vague language invites complaints.
- Gate the script behind consent where required. If your consent management platform blocks analytics until opt-in, the heatmap script belongs in the same gated category. Loading it early defeats the consent flow.
- Turn on automatic masking for form fields. Most tools can mask or exclude input fields by default. Confirm the setting is on before the first session is recorded, not after.
- Exclude sensitive pages entirely. Checkout, account, and support-ticket pages should be on an exclusion list unless you have a specific, documented reason to record them.
- Honor opt-out and deletion requests. Know how to purge a specific visitor's recordings if asked, and document the process.
- Set a retention window. Keep recordings only as long as you need them for analysis, then delete. Indefinite retention is a liability with no analytical upside.
Watch out: a heatmap tool that records keystrokes without masking can capture names, email addresses, and payment details. Verify masking on a test form before you enable collection on any live page.
Mobile and Desktop: Read Them Separately
Mobile and desktop heatmaps often disagree, and the disagreement is the insight. A layout that works on a wide screen can bury the call-to-action on a phone, so review both before you change anything.
- Touch changes the signal. On mobile, there is no hover state, so move maps are largely meaningless. Lean on tap maps and scroll maps instead.
- Thumbs cover the screen. Tap clusters near the bottom corners often reflect where the thumb rests, not where the visitor is looking. Pair tap data with scroll depth to separate reach from attention.
- The fold moves. A phone screen shows far less above the fold. A section that earns attention on desktop may never be seen on mobile without a scroll.
- Segment by device before you compare. Mixing devices in one report averages away the very difference you are trying to find.
Treat heatmaps as quantitative data that points to a question, then use qualitative insights from recordings to answer it. The best practice is not more data, it is a shorter list of questions you can actually answer with the data you are allowed to collect.
Turning Heatmap Findings Into Layout Changes That Lift Conversions
Conversion gains come from small, tested layout changes, not full redesigns, and heatmaps improve user experience by showing exactly which changes to make.
Change one thing at a time so you know what worked. Run the new version against the old one with A/B testing, and let it gather enough traffic to be meaningful.
- Move the primary call-to-action above the cold zone
- Replace dead-click elements with real links or remove them
- Tighten copy in sections with heavy scroll drop-off
- Simplify forms where visitors stall
For layout inspiration, see our high-converting website layout examples, and for a broader playbook read proven tips to improve website conversion rate.
Schedule a Free Consultation to Review Your Heatmap Findings
Heatmaps show you where visitors get stuck. Acting on what they show is the harder half, and that is where hands-on help saves time.
At Real Web Marketing Inc., we bring 35+ years of combined experience to the review, with direct access to experienced marketers rather than junior account managers.
If you have the data but not the plan, find out what's holding back your leads and sales in a free consultation.
Frequently Asked Questions
How do heatmaps help improve user experience?
Heatmaps show where visitors actually click, scroll, and hesitate, so you can spot friction points you would miss in a spreadsheet. A red cluster on a non-clickable image tells you people expect it to be a button. A scroll map that drops off halfway down a pricing page tells you the key content sits too low. Fix those issues and you reduce confusion, shorten the path to a call-to-action, and lift conversion rates without guessing.
What are the different types of website heatmaps?
The three you will use most are click maps, scroll maps, and move maps. Click maps show where people tap or click, including dead clicks on elements that look interactive but are not. Scroll maps show how far down the page visitors reach, which exposes content that never gets seen. Move maps track mouse movement and reveal where attention lands. Together they give you a full picture of user behavior across desktop and mobile.
How long should I run a heatmap test to get accurate data?
Run it long enough to collect a few hundred sessions on the specific page, which usually means one to two weeks for a small business site. Stop early and a handful of repeat visitors can skew the colors. Also segment by device before you draw conclusions, because mobile and desktop behavior often diverge sharply. If traffic is thin, focus on your highest-traffic pages first so the data means something.
Are heatmaps effective for mobile UX optimization?
Yes, but only if you read mobile data separately. Thumb reach, smaller tap targets, and shorter viewports change where people click and how far they scroll, so a desktop heatmap tells you almost nothing about phone users. Compare the two side by side and you will often find that a call-to-action buried below the fold on desktop sits even further out of reach on mobile. That discrepancy is one of the fastest fixes available.