 how-to
Improve Website Conversion Rate: 9 Proven Tips
Table of Contents
- What Your Website Conversion Rate Is Actually Telling You
- Average Website Conversion Rate by Industry
- Landing Page Optimization Best Practices That Drive Results
- Mobile Optimization and Page Speed
- A/B Testing Strategies for Beginners
- Social Proof, Trust Signals, and Psychological Triggers
- Conversion Rate Optimization Tools Worth Using
- Improve Website Conversion Rate Beyond the First Click
Last Updated: August 30, 2026
What Your Website Conversion Rate Is Actually Telling You
Most website owners obsess over traffic. The metric that actually reveals whether your site is working is your website conversion rate, and according to Digital Applied's 2026 Conversion Rate Benchmarks, the median sits at just 2.35% while top performers reach 11.45%. That gap is not a traffic problem. It is a systematic optimization problem. At Real Web Marketing Inc., we work with business owners every day who are driving solid traffic but watching most of it leave without taking action.
Website conversion rate is the percentage of visitors who complete a desired action, such as submitting a form, requesting a quote, or making a purchase. Calculate it by dividing total conversions by total visitors, then multiplying by 100.
"Conversion Rate Optimization (CRO) is the art and science of getting people to act once they arrive on your website." -- Tim Ash, CEO at SiteTuners (Howuku, 2023)
A low conversion rate signals a weak value proposition or friction in the form. A high bounce rate on a product page points to a mismatch between your ad copy and on-page messaging. The data tells a story. Your job is to read it.
How to Calculate Your Conversion Rate
Divide the number of conversions by the total number of visitors in a given period, then multiply by 100. If 5,000 people visited your site last month and 115 filled out a contact form, your conversion rate is 2.3%. Track this number weekly, segment it by traffic channel, and compare it against your industry benchmark.
Average Website Conversion Rate by Industry
Benchmarks are most useful as a diagnostic tool, not a target. According to Ploy's 2026 industry benchmark data, financial services lead with an average conversion rate of 5.01%. Contentsquare's 2026 Digital Experience Benchmark Report, drawn from 99 billion sessions across more than 6,500 websites, found that overall conversion rates declined 5.1% year over year. If your rate held steady while the industry average fell, you actually gained ground.
| Industry | Average Conversion Rate | Notes |
|---|---|---|
| Financial Services | 5.01% | Highest performer by sector |
| E-commerce (general) | 1.5-3% | Cart abandonment still ~70.2% |
| Professional Services | 2-5% | Varies heavily by offer complexity |
| Healthcare | 2-4% | Trust signals are a major driver |
| All industries (median) | 2.35% | Top 10% reach 11.45% |
Chasing the industry average is a low-ambition goal. Businesses in the top decile are systematically optimizing every element of the user journey, from first click to form submission.
Landing Page Optimization Best Practices That Drive Results
The biggest mistake in landing page optimization is treating a page as a brochure rather than a conversion tool. Every element should serve one purpose: moving the visitor toward a specific action.

Research from Tenet's 2026 web design and conversion statistics shows that websites prioritizing user experience can achieve a 400% higher visit-to-lead conversion rate compared to poorly designed sites. Good UX is not aesthetics. It is revenue.
Sharpen Your Value Proposition
Your value proposition is the single clearest reason a visitor should choose you over every alternative. It should appear above the fold, in plain language, within the first five seconds of the page loading.
A strong value proposition answers three questions immediately:
- What do you offer?
- Who is it for?
- Why should I trust you over anyone else?
Vague headlines like "We Help Businesses Grow" fail all three. Specific ones like "HVAC Repair in Under 24 Hours, Guaranteed or Your Inspection Is Free" pass all three. The more specific your promise, the more it resonates with the right visitor and filters out the wrong ones.
CTA Placement and Wording That Converts
Call to action optimization is one of the highest-impact improvements you can make with almost no development cost. Your CTA should be visible without scrolling, repeated at logical decision points, and written in the visitor's language rather than your company's language.
"Submit" converts poorly. "Get My Free Quote" converts better. "Start Saving on My Energy Bill" converts best because it speaks to the outcome the visitor actually wants.
Key CTA principles:
- Use first-person phrasing ("Get My Free Consultation")
- Eliminate ambiguity about what happens next
- Place a CTA above the fold and after every major value statement
- Test button copy before testing color, which has a far larger effect
Mobile Optimization and Page Speed
Mobile accounts for roughly 65% of web traffic, yet mobile conversion rates trail desktop by 42%, according to Digital Applied's 2026 benchmarks. You are sending most of your visitors through a door that is half the width.
Page speed is the most direct lever. A one-second delay in page load time reduces conversions by 7%. When mobile page load time goes from one second to three seconds, the probability of a bounce increases 32%, according to Google's 2026 mobile speed research. A 0.1-second improvement in mobile site speed was linked to an 8.4% increase in retail conversion rate and a 9.2% increase in average order value.
Practical fixes for mobile conversion rate:
- Compress images to under 150KB without visible quality loss
- Eliminate render-blocking JavaScript above the fold
- Use sticky CTAs so the action button remains visible while scrolling
- Reduce form fields to the absolute minimum on mobile
- Test your Core Web Vitals score in Google Search Console monthly
A/B Testing Strategies for Beginners
Most teams wait until they have a "big idea" before they test anything. A/B testing works best as a continuous process, not a periodic event.
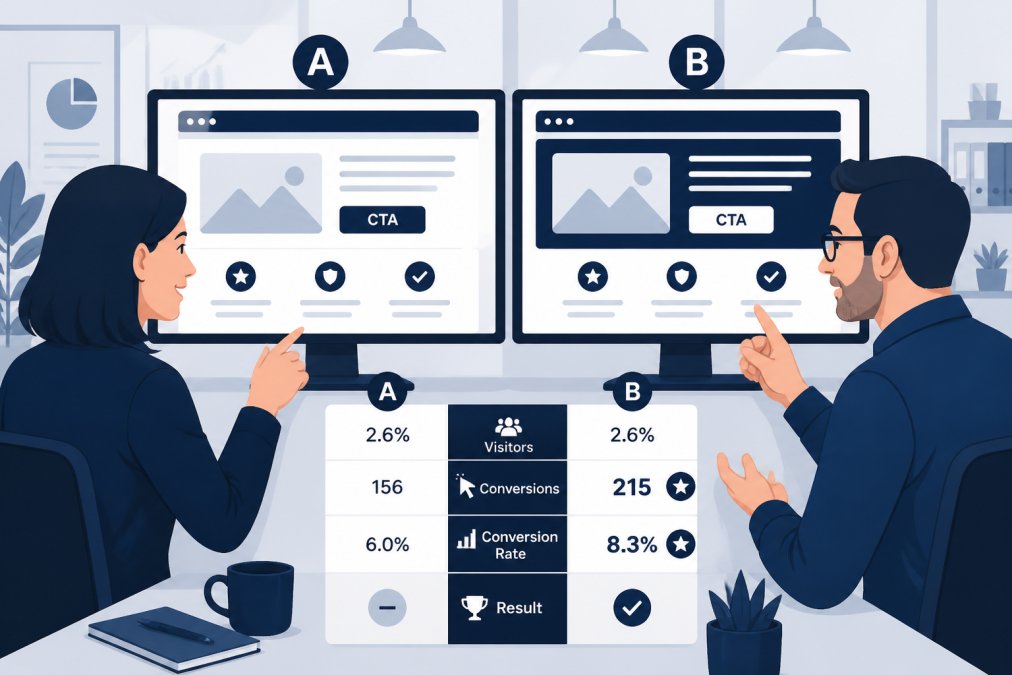
Split testing is the practice of showing two versions of a page element to different visitor segments simultaneously, then measuring which version drives more conversions. Research from HubSpot's marketing research found that fewer than one in five marketers (17%) use landing page A/B tests to improve their conversion rates. That is a significant competitive gap.
AI-powered A/B testing now reaches statistical significance 31% faster than traditional methods, which matters because most small business sites lack the traffic volume for long tests.
Start with these elements in priority order:
| Test Element | Expected Impact | Time to Significance |
|---|---|---|
| Headline / value proposition | High | 2-4 weeks |
| CTA copy and placement | High | 2-3 weeks |
| Form length and fields | Medium-High | 3-4 weeks |
| Page layout and images | Medium | 4-6 weeks |
| Button color | Low | 6+ weeks |
What works on one site may not work on another. Test it. Do not assume it will.
Social Proof, Trust Signals, and Psychological Triggers
Visitors convert because they trust you enough to take a risk. Social proof accelerates that trust transfer faster than any copy you can write yourself.
The most effective trust signals for professional service businesses:
Schedule a Free Consultation →
- Customer testimonials with full names and company names
- Case studies with specific, measurable outcomes
- Third-party review badges from platforms visitors already trust
- Logos of recognizable clients or partners
- Certifications and credentials displayed near the conversion point
These triggers work best when placed at the exact moment of hesitation in the user journey, typically right before the form or checkout step.
Reduce Friction in Your Checkout and Lead Forms
Cart abandonment sits at 70.2% across e-commerce, and lead form abandonment in professional services is not much better. The primary cause is friction: too many fields, unexpected steps, or unclear next steps.
Friction-reduction checklist for forms and checkout:
- Limit contact forms to 3-5 fields maximum for initial inquiries
- Use inline validation so errors appear as the user types
- Add a brief "what happens next" statement below the submit button
- Remove navigation from landing pages to eliminate exit paths
- Display security badges and privacy assurances near any data input field
- Use progress indicators for multi-step forms
- Pre-fill fields where possible using URL parameters or cookies
3M improved site conversion rates by 50% in 12 months through a combination of UX improvements, trust signals, and friction reduction.
Conversion Rate Optimization Tools Worth Using
Conversion rate optimization tools fall into three categories: analytics and visitor behavior, testing and experimentation, and on-page optimization. You need at least one from each category.
Analytics and behavior tools show you what visitors actually do on your pages. Heatmaps reveal where attention concentrates. Session recordings show exactly where users drop off.
Testing platforms let you run A/B and multivariate tests without developer involvement. Look for statistical significance reporting, a tool that does not tell you when a result is reliable is worse than no tool at all.
On-page optimization tools include form builders with conversion analytics, live chat platforms, and personalization engines. Live chat intercepts hesitation at the exact moment it occurs for service businesses.
AI search referral traffic now converts at 3.49% compared to 2.86% from traditional organic search, a 22% higher conversion rate. Optimizing your content to appear in AI-generated answers is becoming a legitimate conversion channel worth tracking.
Improve Website Conversion Rate Beyond the First Click
The most overlooked dimension of CRO is what happens after conversion. Post-conversion retention directly affects the lifetime value of every visitor you convert, which changes the economics of your entire acquisition strategy.
A well-designed post-conversion sequence, including a confirmation email with clear next steps, a follow-up sequence that sets expectations, and a check-in at 30 days, can dramatically increase referrals, repeat business, and reviews.
The practical framework for post-conversion optimization:
- Confirmation page: Clearly state what happens next and when.
- Automated follow-up email: Send within five minutes with the specific service or offer the visitor requested.
- Expectation-setting sequence: Two to three emails over the first week that reduce anxiety and reinforce the decision.
- Review request: Timed at the point of highest satisfaction.
Improving your website conversion rate is an ongoing discipline that compounds over time. Businesses converting at 11.45% or better are running a system, not a single campaign.
Real Web Marketing Inc. has spent 18 years helping small and mid-sized businesses build exactly that kind of system, from high-impact web design and landing pages to transparent monthly reporting that shows exactly where conversions are coming from and where they are leaking.
The challenge for most businesses is not knowing what to fix. It is having the bandwidth and expertise to fix it systematically while running the business. Real Web Marketing Inc. provides hands-on web design, SEO, and PPC management with direct access to experienced marketers, not junior account managers, so you can see exactly where your conversion rate stands and what is moving it. Schedule a Free Consultation with the Real Web Marketing Inc. team and get a clear picture of where your site is leaving revenue on the table.
=== FAQ ANSWERS (audit these too, same rules) ===
[1] Q: What is a good conversion rate for a website? A: The median website conversion rate sits at 2.35% across all industries, but top-performing sites reach 11.45% (Digital Applied, 2026). A realistic goal for most small to mid-sized businesses is to beat the industry average for their sector. Financial services average 5.01%, while e-commerce typically runs lower. Rather than chasing a universal number, benchmark your current rate against your specific industry and set incremental improvement targets from there.
[2] Q: How can you improve conversion rates without more traffic? A: Most conversion gains come from optimizing what you already have, not from adding traffic. Focus on reducing friction in forms and checkout, clarifying your value proposition above the fold, adding trust signals like testimonials and reviews, and improving mobile page speed. A/B testing small changes systematically is the most reliable path to measurable gains.
[3] Q: What common design mistakes hurt conversion rates? A: The biggest design mistakes are slow load times, cluttered layouts with competing calls to action, vague or buried value propositions, and forms that ask for too much information upfront. A one-second delay in page load time reduces conversions by 7% (Akamai research). On mobile, a load time increase from 1 to 3 seconds raises bounce probability by 32% (Google, 2026). Fixing these technical and structural issues often delivers faster conversion rate improvements than redesigning visuals.
[4] Q: How do you calculate website conversion rate? A: Divide the number of conversions by the total number of visitors, then multiply by 100. For example, if your landing page received 1,000 visitors and 25 completed a form, your conversion rate is 2.5%. Define what counts as a conversion for your business first: a form submission, a phone call, a purchase, or a demo request. Tracking each conversion type separately in your analytics gives you a clearer picture of where your sales funnel is gaining or losing visitors.
Frequently Asked Questions
What is a good conversion rate for a website?
The median website conversion rate sits at 2.35% across all industries, but top-performing sites reach 11.45% (Digital Applied, 2026). A realistic goal for most small to mid-sized businesses is to beat the industry average for their sector. Financial services average 5.01%, while e-commerce typically runs lower. Rather than chasing a universal number, benchmark your current rate against your specific industry and set incremental improvement targets from there.
How can you improve conversion rates without more traffic?
Most conversion gains come from optimizing what you already have, not from adding traffic. Focus on reducing friction in forms and checkout, clarifying your value proposition above the fold, adding trust signals like testimonials and reviews, and improving mobile page speed. A/B testing small changes systematically is the most reliable path to measurable gains.
What common design mistakes hurt conversion rates?
The biggest design mistakes are slow load times, cluttered layouts with competing calls to action, vague or buried value propositions, and forms that ask for too much information upfront. A one-second delay in page load time reduces conversions by 7% (Akamai research). On mobile, a load time increase from 1 to 3 seconds raises bounce probability by 32% (Google, 2026). Fixing these technical and structural issues often delivers faster conversion rate improvements than redesigning visuals.
How do you calculate website conversion rate?
Divide the number of conversions by the total number of visitors, then multiply by 100. For example, if your landing page received 1,000 visitors and 25 completed a form, your conversion rate is 2.5%. Define what counts as a conversion for your business first: a form submission, a phone call, a purchase, or a demo request. Tracking each conversion type separately in your analytics gives you a clearer picture of where your sales funnel is gaining or losing visitors.
This article was written using GrandRanker